Optimizing an urban telecommunications network.
This article is the result of my second student research project (last one on photopletysmography was for my first year).
Abstract
References :
[1] Site internet ANFR : Observatoire ANFR : Au 1er décembre 2022 : www.anfr.fr, publié le 06 décembre 2022 consulté le 05/01/2023.
[2] HUVE Julien : « Les enjeux du secteur des télécoms » : Agence de d’étude et de conseil MAZARS www.mazars.fr, consulté le 08/01/2023
[3] RAPPAPORT, T. S. : Wireless Communications : principles and practice : Prentice Hall, seconde édition
[4] MARTIN Loïc : « Conception d’une antenne compacte de station de base pour réseaux cellulaires » : Université de Nantes, 2017
[5] MELLAH Amine « Modélisation statistique d’antennes dans leurs environnements.» : Université Paris Sud - Paris XI, 2010. Français.
[6] GRANATSTEIN, V. L. : « Physical principles of wireless communications. » : Auerbach Publications. (2008) p139
[7] MARTY Alexandre :« Optimisation du placement et de l’assignation de fréquences d’antennes dans un réseau de télécommunications »: École Polytechnique De Montréal NOVEMBRE 2011
[8] Mendes, S.P., Molina, G., Vega-Rodrguez, M.A., Gomez-Pulido, J.A., Sez, Y., Miranda, G., Segura, C., Alba, E., Isasi, P., Len, C., Snchez-Prez, J.M. : « Benchmarking a Wide Spectrum of Meta-Heuristic Techniques for the Radio Network Design Problem » : IEEE Transactions on Evolutionary Computation, 1133–1150 (2009)
Project’s Objectives
- Developing a Theoretical Propagation Model
- Experimental Demonstration of Physical Phenomena Associated with this Propagation
- Application of the Model in Computer Simulation
Finding a Model
As we know, telecommunication signals are EM-waves send all around an antenna. The easiest model there is to model this is wave propagation in an empty space. The idea is to place a emission point, that emits equivalently in all direction waves. With the theory of Maxwell, we can find the power receive in a point of the space. In particular, the Friis equation is given by :

P_r = \int_A \vec{\pi} . d\vec{A} \rVert \vec{A} \rVert = \frac{\lambda^2}{4\pi} G_r\rVert\vec{\pi}\rVert = 2.1860 (\frac{A}{\lambda_0})^2\rvert I_A \rvert^2 \frac{sin(θ)^2}{d^2}We now have the Poynting’s vector in a 2D space if two antennas are directly interacting with one another.
The idea is now to simplify it with constant (constant Ge and Gr, wavelength λ, distance in between d) that will be easy to implement in the code.
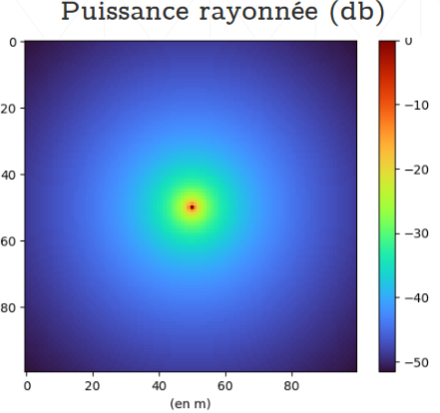
\vec{\pi} = \frac{P_eG_e}{4\pi d^2} \,\, => \frac{P_{recepted}}{P_{emitted}} = G_eG_r \frac{\lambda}{4\pi d}^2Once implemented in python, we get this result. A strong power in the centre (at the emission) and logarithmic-ly decreasing.
import numpy as np
import matplotlib.pyplot as plt

'''
#Valeurs numeriques
Ge = 50 #Gain classique d'une antenne (12 db)
900 Mhz, 3G dans le vide UMTS 900
Pe = 60 Watts
Puissance PIRE (puissance isotrope rayonnee equivalente) : Ge * Pe = 50*60 = 3kW
'''


_lambda = 0.333  # longeur d'onde à 900 Mhz, 3G dans le vide UMTS 900
Pe = 60
Ge = 50
Gr = 1

# Position de l'antenne au centre
taille = 100
antenne = (taille // 2, taille // 2)


def distAtO(B):
    """
        Distance à l'antenne
    """
    return np.sqrt((B[0] - antenne[0]) ** 2 + (B[1] - antenne[1]) ** 2)


def f(x, y):
    """
    Calcul de la puissance en (x,y)
    """
    d = distAtO((x, y))
    P = (_lambda / (4 * 3.14 * d)) ** 2 * Pe * Ge * Gr
    if d < 1:
        P = Pe
    return P


plotpowergrid = [[10 * np.log(f(x, y)/Pe) / np.log(10) for y in range(0, taille)] for x in range(taille)]

plt.imshow(plotpowergrid, interpolation='none', cmap='turbo')
plt.colorbar()
plt.title("Puissance rayonnée (en db)")
plt.xlabel("(en m)")
plt.show()
This model is very basic. It is pretty helpful in certain use case but we can push the theory further to better approximate reality. Another idea is to take into account two rays. As we know in wave theory, when two wave collide with each other, depending on the phase, there are interferences either constructive or destructive. To see how much this will impact our study, I made the Lloyd’s mirrors experiment.
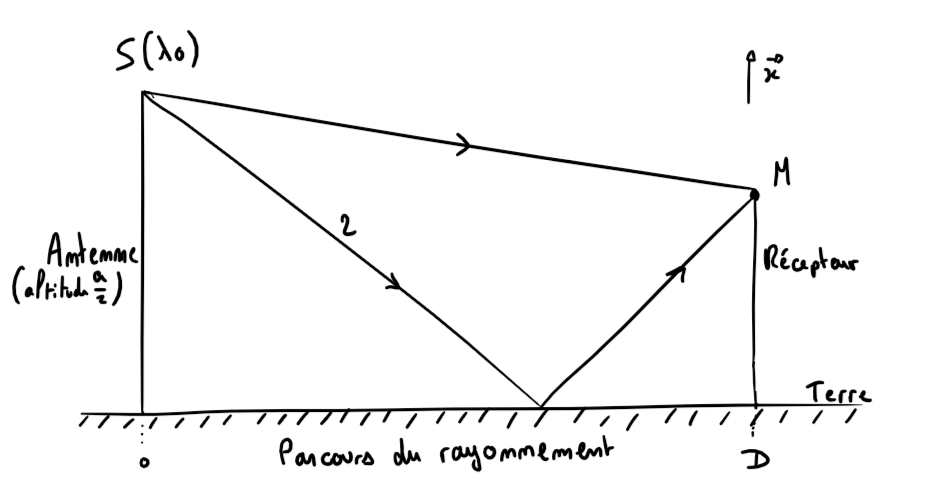
As there are constructive and destructive interferences, a zebra pattern is observable on a screen (multiple vertical position of the point M in the later figure). In lab, this could be recreated by a mirror symbolising the earth and a laser a power source.
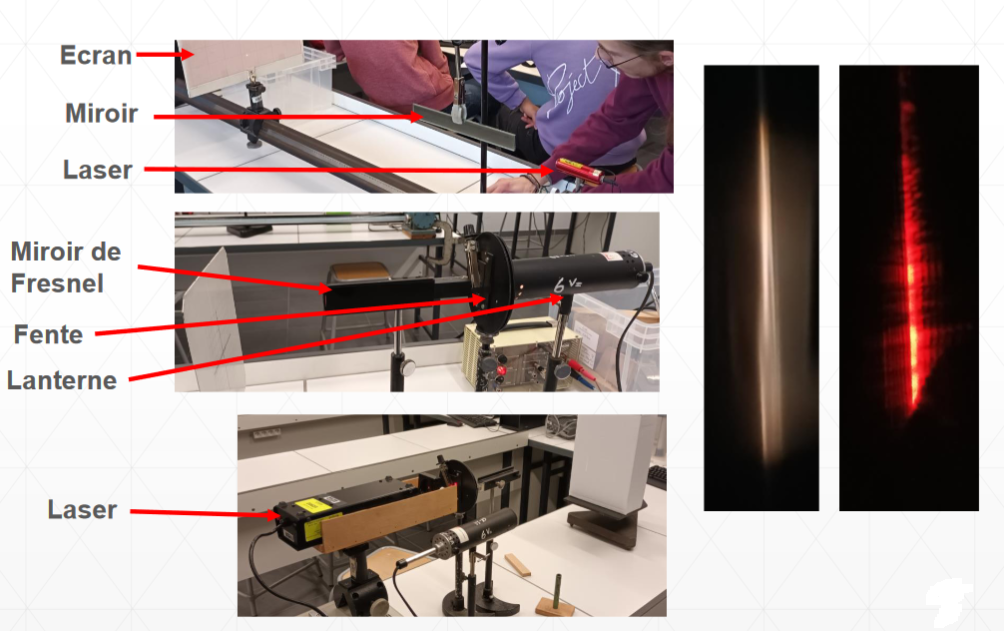
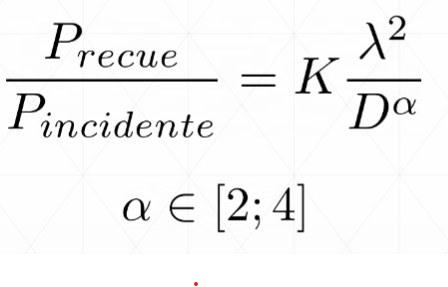
This experiment proves that the phenomenon exist but is not very present in our study. In a different context, a subway for instance or in dense areas, it can be taken into account. So we can now modify the model (I pass the explanation for all the others phenomenon such as absorption, reflexion, etc..) to better represent reality. The formula is quite the same but with a power that changes depending on the environment (ex: 2 if empty, 4 if very dense)
Dive into the code
Now that we have the model and access to the power all over the 3D space. We can start coding.
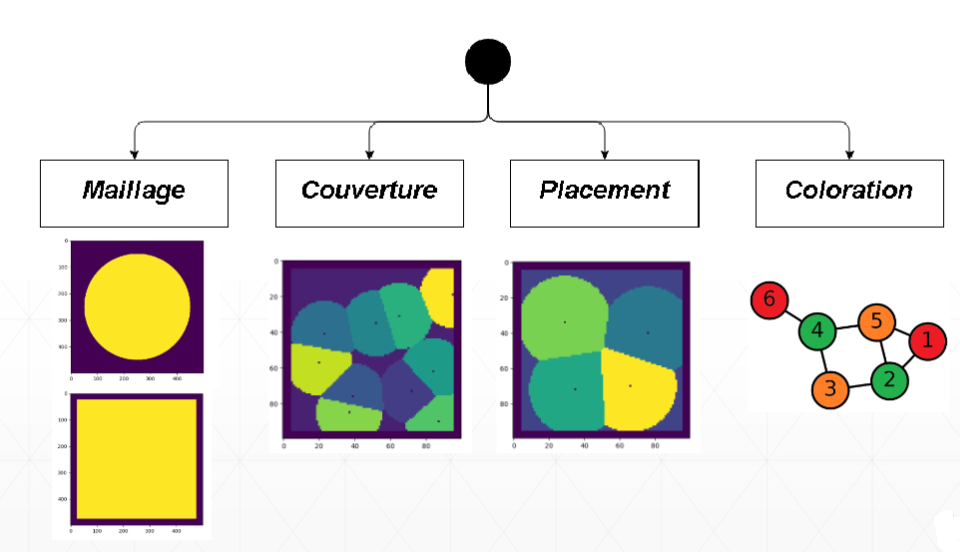
The first step is creating the space. We are using here a 2D space and points to represent antennas. The 2D space can be either rectangular, circular, etc.. this is something we can modify later on. We also want see what part are covered by the antennas so we will use colours. Then we will find a way to optimise the position of the antennas. And finally to reduce interference, constructors often use different wavelength when two antennas are too close, something we will represent by colouring a graph representing our system.
2D Space and Antennas
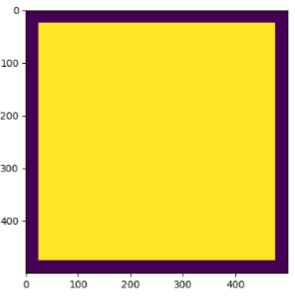
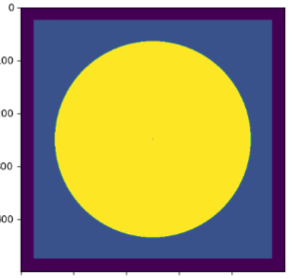
The 2D space is just a matrix where a values are equal to 1 whereas impossible positions are set to 0. I used two classes in the project : a rectangular and a circular.
Distribution :
class Maillage:
    """
    Contructeur abstrait d'un maillage vide

    """

    def __init__(self, n1=500, n2=500):  # X.Y
        self.density = np.ones((n1, n2))
        self.density = self.density * -1

        self.maillage_np = np.zeros(
            (n1, n2))  # tableau de la distribution -> si dist_np[i,j] >=1 alors fait partie du terrain
        self.shape = (n1, n2)
        self.n1 = n1
        self.n2 = n2
        self.area = 0
        self.echelle = 1

    def getnumbaDensityList(self):
        numba_list = List()
        for lst in self.density.tolist():
            numba_list.append(lst)
        return numba_list

    def Generate(self):
        """
        Fonction abstaite
        """
        pass

    def setDensity(self, density):
        for i in range(self.n1):
            for j in range(self.n2):
                if self.maillage_np[i, j] >= 1:
                    self.density[i, j] = density[i, j]

    def showDensity(self):
        """
        Plot la densité associée
        """
        plt.figure()
        plt.imshow(self.density, interpolation='none')

    def show(self):
        """
        Plot la distribution
        """
        plt.figure()
        plt.imshow(self.maillage_np, interpolation='none')
Rectangle :
class MaillageRectangulaire(Maillage):
    """
    Crée un maillage à base rectangulaire
    """

    def __init__(self, n1=500, n2=500):
        super().__init__(n1, n2)
        distLat, distVert = n1 * 0.05, n2 * 0.05
        self.distLat = distLat
        self.distVert = distVert
        self.area = n1 * n2

    def Generate(self):
        super().Generate()
        for i in range(self.n1):
            for j in range(self.n2):
                if self.distLat <= i <= (self.shape[0] - self.distLat) and self.distVert <= j <= (
                        self.shape[1] - self.distVert):
                    self.maillage_np[i, j] = 1
Circular :
class MaillageCirculaire(Maillage):
    """
    Maillage circulaire
    """

    def __init__(self, n1=500, n2=500, radius=200):
        super().__init__(n1, n2)
        self.centre = (n1 // 2, n2 // 2)
        self.radius = radius
        self.area = int(np.pi * radius ** 2)

    def Generate(self):
        super().Generate()
        for i in range(self.n1):
            for j in range(self.n2):
                if (i - self.centre[0]) ** 2 + (j - self.centre[1]) ** 2 <= self.radius ** 2:
                    self.maillage_np[i, j] = 1
We can now place antennas in this space, each antennas will handle the computations for its power range and coverage. This is all placed in “Power Matrixes” that represent the power in a certain point. More over, I had to compile some functions in C with the njit compiler. This fastened calculation and drastically reduced computation time.
To compute the building density (changing the α in the power formula) I used a perlin noise.
def GeneratePerlinDensity(X, Y, _octaves=5, _seed=1):
    """
    Génère une densité de batiments avec un bruit de perlin aléatoire sur le maillage.
    Renvoit un tableay numpy de cette même distribution.

    """
    noise = PerlinNoise(octaves=_octaves, seed=_seed)
    density = np.zeros((X, Y))
    for i in range(X):
        for j in range(Y):
            density[i, j] = noise([i / X, j / Y])

    return density
@njit
def pow2_dist2D(x1, y1, x2, y2):
return np.power(x1 - x2, 2) + np.power(y1 - y2, 2)
def FindAntennasById(AntennaList, _id):
for el in AntennaList:
if el.id == _id:
return el
return None
class Antenna:
_IDcounter = 1 # Utile pour le calcul d'identifiant commence à 1 (+ simple)
_lambda = 0.333 # longeur d'onde à 900 Mhz, 3G dans le vide UMTS 900
Pe = 60
Ge = 50
Gr = 1
def __init__(self, x, y, canal=randint(0, 900)):
self.x = x
self.y = y
self.power = (Antenna._lambda / (4 * 3.14)) ** 2 * Antenna.Pe * Antenna.Ge * Antenna.Gr # En pourcentage de la puissance disponible +0.5 *2
self.minDist = 1 # Gère l'asymptote en 0
self.MatPower = None # Matrices de puissance rayonnée sur chaque points
self.MatZoneCouverture = None # Matrices de la couverture (1 = couvert)
self.area = 0
self.signalToNoiseRatio = None
# Pour l'attribution des canaux
self.canal = canal
# Identifiant unique
Antenna._IDcounter += 1
self.id = Antenna._IDcounter
def reset(self):
self.power = (Antenna._lambda / (4 * 3.14)) ** 2 * Antenna.Pe * Antenna.Ge * Antenna.Gr
self.minDist = 1 # Gère l'asymptote en 0
self.MatPower = None # Matrices de puissance rayonnée sur chaque points
self.MatZoneCouverture = None # Matrices de la couverture (1 = couvert)
self.area = 0
self.signalToNoiseRatio = None
def processPowerMatrix(self, X, Y, distribution):
self.MatPower, self.signalToNoiseRatio = compiledPowerCalc(X, Y, distribution.maillage_np, self.x, self.y, self.minDist, self.power, distribution.echelle, distribution.getnumbaDensityList())
return self.MatPower
def ProcessZoneCouvertureEmpty(self, X, Y):
"""
Calcule la matrice de couverture si l'antenne était seule
"""
del self.MatZoneCouverture
self.MatZoneCouverture = np.zeros((X, Y))
for i in range(X):
for j in range(Y):
if self.MatPower[i, j] >= 20:
self.MatZoneCouverture[i, j] = self.canal
return self.MatZoneCouverture
@njit
def compiledPowerCalc(_X, _Y, _distMat, cX, cY, _minDist, _power, _ech, densityMat):
MatPower_ = np.zeros((_X, _Y))
signalToNoiseRatio_ = np.zeros((_X, _Y))
for i in range(_X):
for j in range(_Y):
if _distMat[i, j] >= 1:
dst_pow2 = np.sqrt((np.power(i - cX, 2) + np.power(j - cY, 2)) * _ech)
# Cette dijonction permet de traiter la divergence de la puissance quand la
# distance tend vers 0
if dst_pow2 >= _minDist ** 2:
#MatPower_[i, j] += _power / dst_pow2**2 Modèle dans le vide
alpha = 2 + (densityMat[i][j] + 0.5) * 2
MatPower_[i, j] += _power / dst_pow2**alpha
else:
MatPower_[i, j] += _power
return MatPower_, signalToNoiseRatio_
Optimizing
Now that our code can display 2D space and place antennas, we can optimize those positions. A way of doing is to generate randomly a configuration and then compute a score to each one, take the best one out of it and slightly modify the antennas’ positions and see if it improves this score.
I used an empirical score that I find works approximately every time. I’m not sure, it’s an optimal solution but it is a pretty good one.

#import gc

# import numpy as np
# import matplotlib.pyplot as plt
from random import randrange as random_range
# OPTIMISATION algo génétique
#import cProfile

import Distribution
import Antennas
from PowerCalculations import *
from GeneticUtils import *
import Density


# CONSTANTE DU PROBLEME
global NB_CONFIGURATION_PAR_GENERATION
global TAILLE_TABLEAUX
global NOMBRE_ANTENNES
global GAIN_ANTENNE
global maillage  # définit plus tard

NB_CONFIGURATION_PAR_GENERATION = 10
TAILLE_TABLEAUX = 100
NOMBRE_ANTENNES = 15
ECHELLE = 10**1

# ETAPE 0 : Générer le maillage avec la bonne taille
#maillage = Distribution.MaillageCirculaire(TAILLE_TABLEAUX, TAILLE_TABLEAUX, TAILLE_TABLEAUX // 2 - 10)
maillage = Distribution.MaillageRectangulaire(n1=TAILLE_TABLEAUX, n2=TAILLE_TABLEAUX)
maillage.Generate()
maillage.echelle = ECHELLE
perlin = Density.GeneratePerlinDensity(maillage.shape[0], maillage.shape[1])
maillage.setDensity(perlin)


def RechercheGenetiqueKAntennes(searchRadius=50, n=5, k=5):
    """
    Appliquer l'algorithme de recherche en modifiant une antenne à chaque génération
    """
    gen = 1
    print("###############################################################################################")
    print("# Algorithme d'optimisation du placement, plusieurs antennes à la fois, méthode par génétique #")
    print("################################## Esteban Real ###############################################")

    # La solution
    config_optimale_all_time = []
    eval_config_optimale_at = np.inf
    coverMatrixOptimale = np.ones((TAILLE_TABLEAUX, TAILLE_TABLEAUX)) * -1
    liste_score = []
    xs_liste_score = []

    # ETAPE 1 : Générer une population aléatoire d'emplacements d'antennes : On commence par générer un ensemble aléatoire
    # de configurations d'antennes.
    print("-- Etape 1 --")
    liste_configuration = []  # tableau contenant un tableau avec la liste de chaques antennes pour cette configuration

    # INITIALISATION DES CONFIGS INITIALES
    for _ in range(NB_CONFIGURATION_PAR_GENERATION):
        liste_antenne = []
        for _ in range(NOMBRE_ANTENNES):  # Placement aléatoire des antennes
            x = random_range(0, TAILLE_TABLEAUX)
            y = random_range(0, TAILLE_TABLEAUX)
            while maillage.maillage_np[x, y] != 1:  # Tant que le point ne fait pas partie de la zone contructible
                x = random_range(0, TAILLE_TABLEAUX)
                y = random_range(0, TAILLE_TABLEAUX)

            rd = Antennas.Antenna(x, y)
            rd.canal = 0
            liste_antenne.append(rd)
        liste_configuration.append(liste_antenne)

    # ETAPE 2 : A chaque génération, évaluer chaque configuration de la population.
    # Pour cela, on utilise les niveaux de signal reçus par les utilisateurs en fonction de la distance et de la position des antennes.
    for _c in range(n):

        coverMatrixes = []  # tableau contenant les matrices de couverture de chaques configuration (pour visualisation)

        print("-------------------------")
        print("Génération : " + str(gen))
        for configuration in liste_configuration:
            # Calcul de la puissance en chaque point
            powergridslistbycanal = [np.zeros((TAILLE_TABLEAUX, TAILLE_TABLEAUX))]
            # print(len(configuration))
            ProcessAllPowerMatrix(configuration, maillage)

            # Calcul de la matrice des couvertures
            powergridslistbycanal[0] = UpdateCanalPowerMatrix(powergridslistbycanal[0], configuration)
            coverMatrix = np.zeros((TAILLE_TABLEAUX, TAILLE_TABLEAUX,
                                    2))  # Associe à chaque point du maillage l'id de l'antenne prédominante et la puissance de celle-ci
            coverMatrix = ProcessCoverMatrix(coverMatrix, configuration, powergridslistbycanal, maillage)
            coverMatrixes.append(coverMatrix)

        # ETAPE 3 : Evaluer la configuration
        # idée : minimiser le rapport np.var/np.mean
        id_config_optimale, score = EvalConfig(liste_configuration, maillage.area)
        config_optimale = liste_configuration[id_config_optimale]
        # ShowCoverMatrix(coverMatrixes[id_config_optimal], config_optimal)
        print("Id config optimale de la génération : " + str(id_config_optimale))

        if score <= eval_config_optimale_at:
            print("Nouvelle Meilleure : score = " + str(score))
            eval_config_optimale_at = score
            config_optimale_all_time = config_optimale
            coverMatrixOptimale = coverMatrixes[id_config_optimale]
            PrepareToShowCoverMatrix(coverMatrixOptimale, config_optimale)
            liste_score.append(score)
            xs_liste_score.append(gen)

        # ETAPE 4 : Préparer des nouvelles configurations
        new_liste_configuration = []

        # Choisir des antennes à modifier au hasard
        a_ToMove_id_inlist = []
        chosenAntennas = []
        a_IdList = []

        for _k in range(k):
            r = random_range(0, len(config_optimale_all_time))
            while r in a_ToMove_id_inlist:
                r = random_range(0, len(config_optimale_all_time))
            a_ToMove_id_inlist.append(r)

        for i in range(len(a_ToMove_id_inlist)):
            chosenAntennas.append(config_optimale_all_time[a_ToMove_id_inlist[i]])
            print("Antenne à modifier : " + str(config_optimale_all_time[a_ToMove_id_inlist[i]].id))
            a_IdList.append(config_optimale_all_time[a_ToMove_id_inlist[i]].id)

        for _ in range(NB_CONFIGURATION_PAR_GENERATION):
            liste_antenne = []
            for _k in range(len(a_ToMove_id_inlist)):
                x = random_range(0, TAILLE_TABLEAUX)
                y = random_range(0, TAILLE_TABLEAUX)
                while maillage.maillage_np[x, y] != 1 or (x - chosenAntennas[_k].x) ** 2 + (  ####SUREMENT FAUX
                        y - chosenAntennas[_k].y) ** 2 > searchRadius ** 2:  # Nouvelle position aléatoire pour cette antenne
                    x = random_range(0, TAILLE_TABLEAUX)
                    y = random_range(0, TAILLE_TABLEAUX)

                newAntenna = Antennas.Antenna(x, y)
                newAntenna.canal = chosenAntennas[_k].canal
                liste_antenne.append(newAntenna)

            for antennes_old in config_optimale_all_time:
                if antennes_old.id not in a_IdList:
                    liste_antenne.append(antennes_old)
                    antennes_old.reset()

            new_liste_configuration.append(liste_antenne)

        # Modifier la liste de travail
        liste_configuration = new_liste_configuration.copy()
        gen += 1

    ShowCoverMatrix(coverMatrixOptimale, config_optimale_all_time)
    ShowAllStoredCoverMatrix()
    plt.figure()
    plt.plot(xs_liste_score, liste_score)

    return config_optimale_all_time, coverMatrixOptimale


# cProfile.run('RechercheGenetiqueKAntennes(n=10, k=3, searchRadius=10)')
plt.show(block=True)
def EvalConfig(listconfig, totalArea):
"""
Permet de calculer min[pour chaque configuration](variance(aire de la couverture) / valeur moyenne de la couverture)
Retourne : indice de la "meilleure" config
Complexity : O(len(config) * len(config[i]))
"""
ratio_list = np.zeros(len(listconfig))
for c in range(len(listconfig)):
curr_config = listconfig[c]
areas = np.zeros(len(curr_config))
for i in range(len(curr_config)):
areas[i] = curr_config[i].area # récupère toutes les aires
mean = np.mean(areas)
var = np.var(areas)
ratio_list[c] = 0.6 * totalArea/mean + .4 * var/totalArea
return np.argmin(ratio_list), np.min(ratio_list)
Here are some results without and with density.
